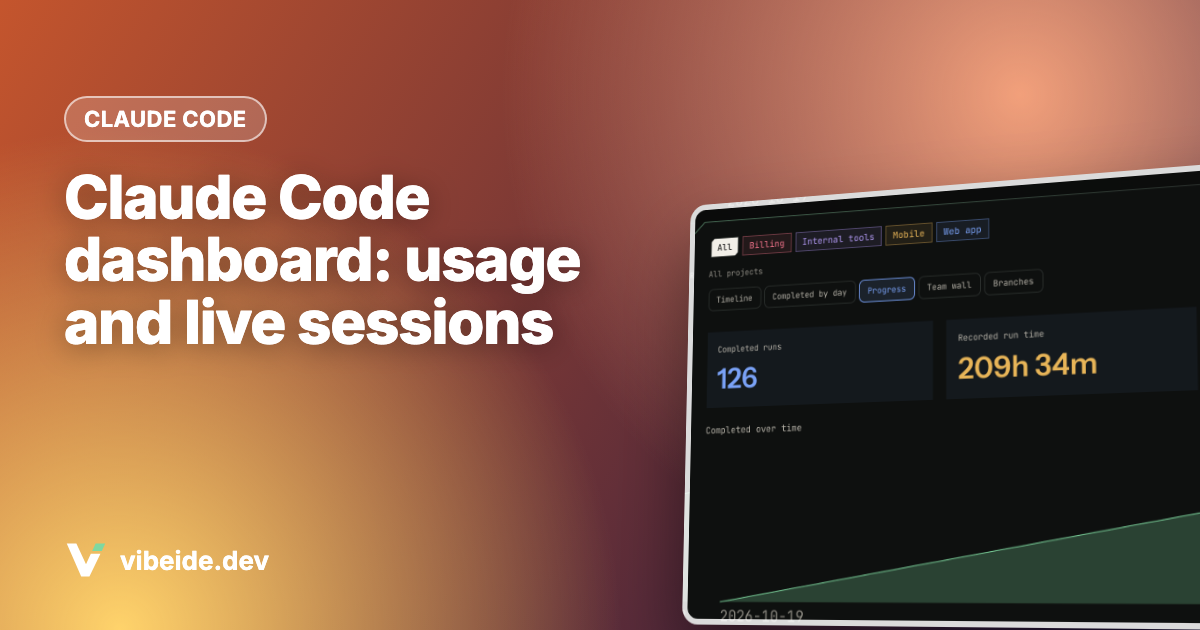
A Claude Code dashboard is one screen that tells you what your Claude Code use looks like: how much you spent or have left, which sessions are running, and what they produced. As of November 2026 there are four of them, and which one you want depends on the question. Use /usage for your own limits and cost, agent view (claude agents) for live sessions, the analytics dashboard for a team on a Teams, Enterprise or Console plan, and an OpenTelemetry export when you want your own charts.
Which Claude Code dashboard do you need?
Start from the question you are trying to answer, not from the tool.
| Question | Dashboard | Who can use it |
|---|---|---|
| How much of my limit is left, and what is using it? | /usage in Claude Code | Everyone |
| Which sessions are running, waiting or done? | Agent view, claude agents | Everyone (research preview) |
| How is my team adopting Claude Code? | Analytics dashboard | Team and Enterprise admins, Console users with UsageView |
| I want custom charts and alerts | OpenTelemetry export to your own stack | Anyone who runs a collector |
| What did I ask in which project, across several CLIs? | A desktop workspace such as VibeiDE | Anyone using Claude Code, Codex or OpenCode |
The rest of this guide walks through each one with the exact commands and URLs, checked against the official documentation on 14 November 2026.
The personal dashboard: /usage
For a single developer, /usage is the dashboard. Run it inside any Claude Code session.
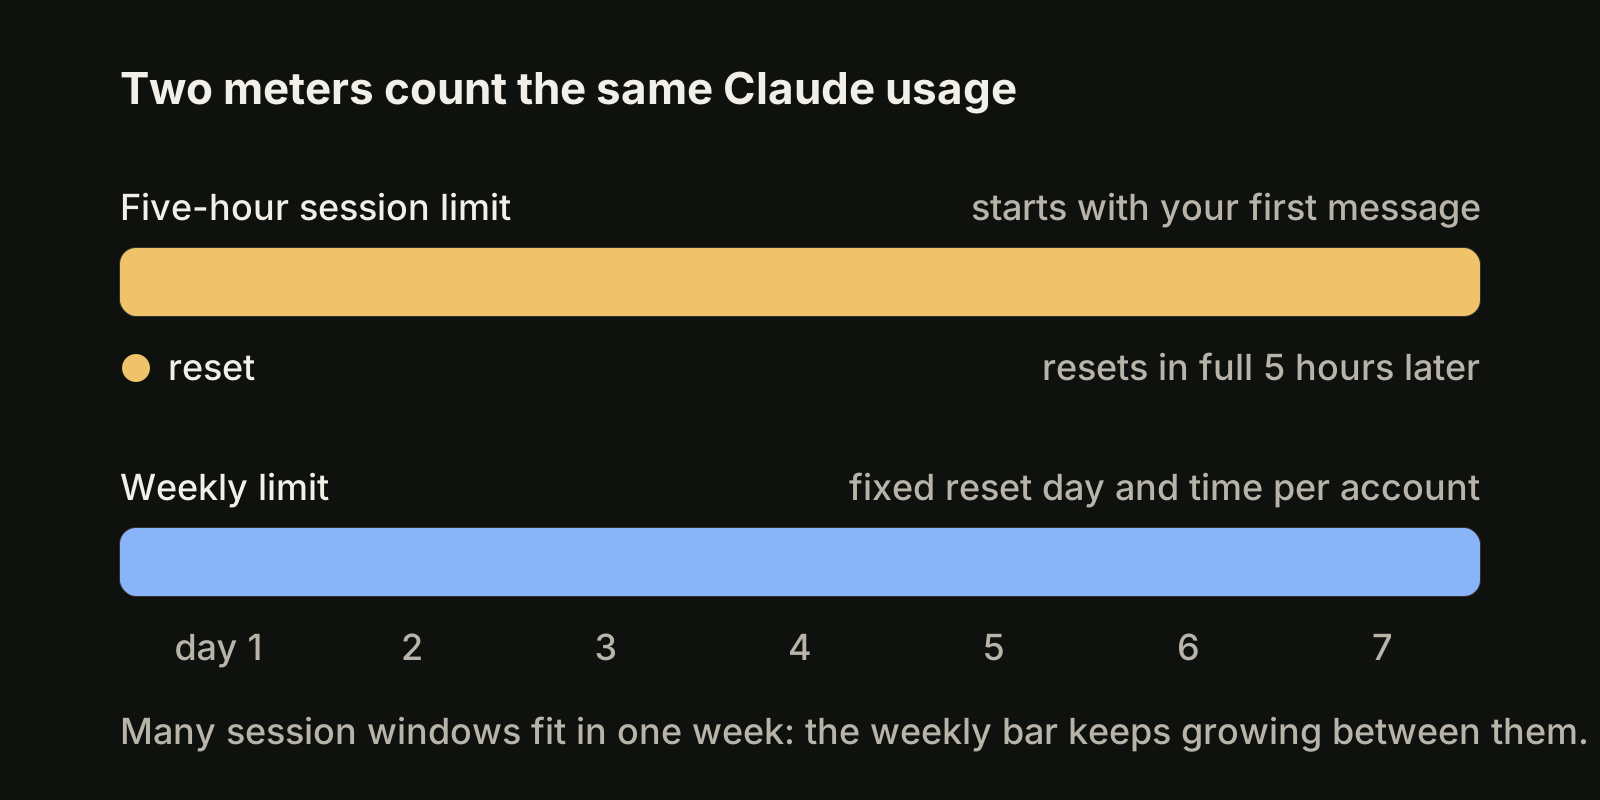
What it shows depends on how you sign in, according to the Claude Code cost documentation:
- Session block. Token use for the current session, total duration and code changes, plus a dollar figure computed locally at list price. It is an estimate, and it resets when
/clearstarts a new session. - Plan usage bars. On Pro, Max, Team and Enterprise plans you see your plan usage, activity stats and a breakdown of what counts against your limits.
- Attribution. The share of recent usage that went to skills, subagents, plugins and individual MCP servers.
- Recommendations. Rows such as trimming a large CLAUDE.md or lowering effort, each with the share of recent usage it applies to. From v2.1.305, pressing
fapplies the ones Claude Code can act on.
Press d or w to switch between the last 24 hours and the last 7 days. The breakdown is built from local session history on that machine, so usage from other devices or claude.ai is not in it. For a weekly plan, pair it with our guide on the Claude Code weekly limit.
If you want those numbers on screen all the time rather than on demand, a custom status line can show context, cost and limits under the prompt. See Claude Code statusline.
/insights: a report on how you work
/insights is the other personal view. It analyzes up to 200 recent sessions on the machine and writes an HTML report to ~/.claude/usage-data/report.html covering what you work on, friction points and suggestions. The analysis runs on your normal account, so its tokens count against your plan.
The live sessions dashboard: agent view
When you run several sessions at once, the question changes from "how much" to "which one needs me". Agent view answers it. It is a single terminal screen for all background Claude Code sessions, in research preview as of November 2026.
claude agents                         # open agent view
claude agents --cwd ~/projects/api    # only sessions started under that folder
claude agents --json --all            # print sessions as JSON, including completed ones
claude --bg --name "fix-login" "fix the login redirect loop"   # start a named background session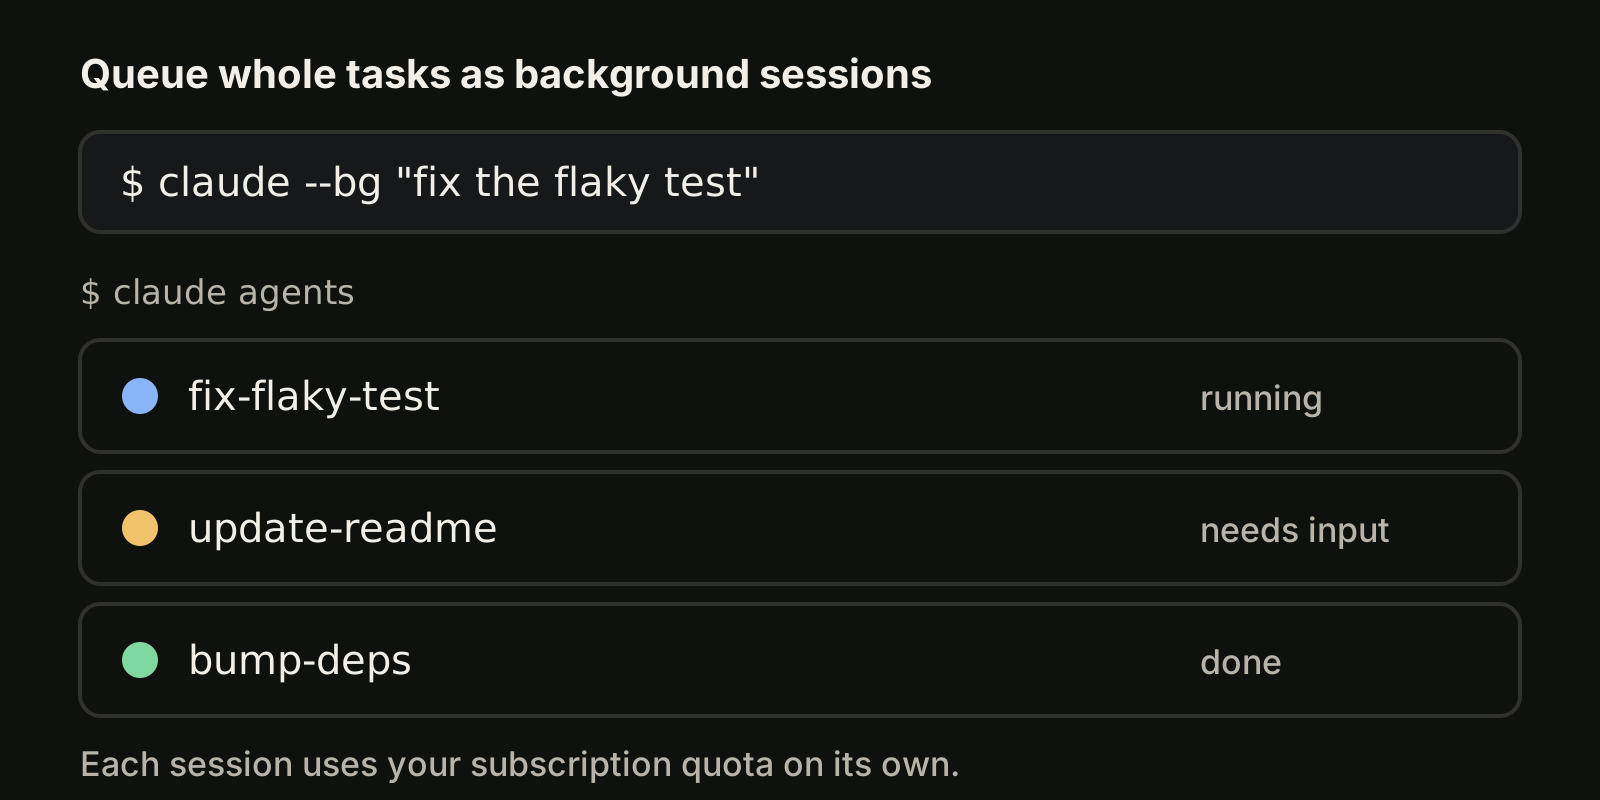
Rows are grouped as Pinned, Ready for review, Needs input, Working and Completed, and Ctrl+S switches to grouping by directory. Each row shows the session name, a one-line summary or the question it is asking, and its age. A #N label links to the session's pull request, coloured by status. Space opens a peek panel with a reply box, Enter attaches, and Ctrl+X stops a session.
Two details make it work as a dashboard rather than a list of tabs. Sessions run under a supervisor process, so they keep going after you close the view or the terminal. And each session edits files in its own git worktree under .claude/worktrees/, so parallel sessions do not write to the same checkout. The full command list is in the agent view documentation, and our Claude Code session manager guide covers daily use.
claude agents --json is also the easiest way to feed your own dashboard: pipe it into a script and you have the state of every session as data.
The team dashboard: Claude Code analytics
For organizations, Anthropic hosts a Claude Code analytics dashboard. Where it lives depends on the plan, per the analytics documentation:
| Plan | Dashboard address | Shows |
|---|---|---|
| Claude for Teams or Enterprise | claude.ai/analytics/claude-code | Usage, contribution metrics with GitHub, leaderboard, CSV export |
| API (Claude Console) | platform.claude.com/claude-code | Usage, spend, per-member team insights |
On Teams and Enterprise, Admins and Owners can view it. Usage metrics include lines of code accepted, suggestion accept rate, and daily active users and sessions. Contribution metrics (PRs and lines shipped with Claude Code) are a public beta that needs an Owner to enable Claude Code analytics and the "GitHub analytics" toggle, plus a GitHub admin to install the Claude GitHub app. Data usually appears within 24 hours and updates daily, and merged PRs with Claude Code lines get the claude-code-assisted label in GitHub. Contribution metrics are not available with Zero Data Retention.
On the Console, you need the UsageView permission (Developer, Billing, Admin, Owner and Primary Owner roles have it). The page shows lines accepted, accept rate, daily activity and daily spend, with a team insights table of spend and lines per member this month. Spend there is an estimate; the billing page is the real number.
For data outside the browser, the Console offers the Claude Code Analytics API with an Admin API key, and Enterprise plans offer the Enterprise Analytics API with a read:analytics key. The Teams plan exports a spend report CSV instead.
Build your own dashboard with OpenTelemetry
The hosted dashboards do not cover cloud providers such as Amazon Bedrock, and they update daily. For near real-time charts in your own observability stack, Claude Code exports OpenTelemetry metrics and events. The monitoring documentation gives this setup:
export CLAUDE_CODE_ENABLE_TELEMETRY=1
export OTEL_METRICS_EXPORTER=otlp          # or prometheus, console, none
export OTEL_LOGS_EXPORTER=otlp             # events
export OTEL_EXPORTER_OTLP_PROTOCOL=grpc    # no default, so set it
export OTEL_EXPORTER_OTLP_ENDPOINT=http://localhost:4317
claude
The metrics worth charting first:
| Metric | What it counts |
|---|---|
claude_code.session.count | CLI sessions started |
claude_code.cost.usage | Session cost in USD |
claude_code.token.usage | Tokens used |
claude_code.lines_of_code.count | Lines modified |
claude_code.commit.count and claude_code.pull_request.count | Commits and PRs created |
claude_code.active_time.total | Active time in seconds |
Each metric carries attributes such as session.id and user.id, so you can split by developer. To check the pipeline, look for claude_code.session.count; for logs, send a prompt and look for the claude_code.user_prompt event. Prompt and response text is redacted unless you set OTEL_LOG_USER_PROMPTS=1 or OTEL_LOG_ASSISTANT_RESPONSES=1. If nothing arrives, run claude --debug-file <path> and search for [3P telemetry] errors.
A dashboard across projects and agent CLIs
Every dashboard above sees Claude Code only. If your day also includes Codex or OpenCode, and several repositories, the hard part is knowing what you asked where and what still needs a review.
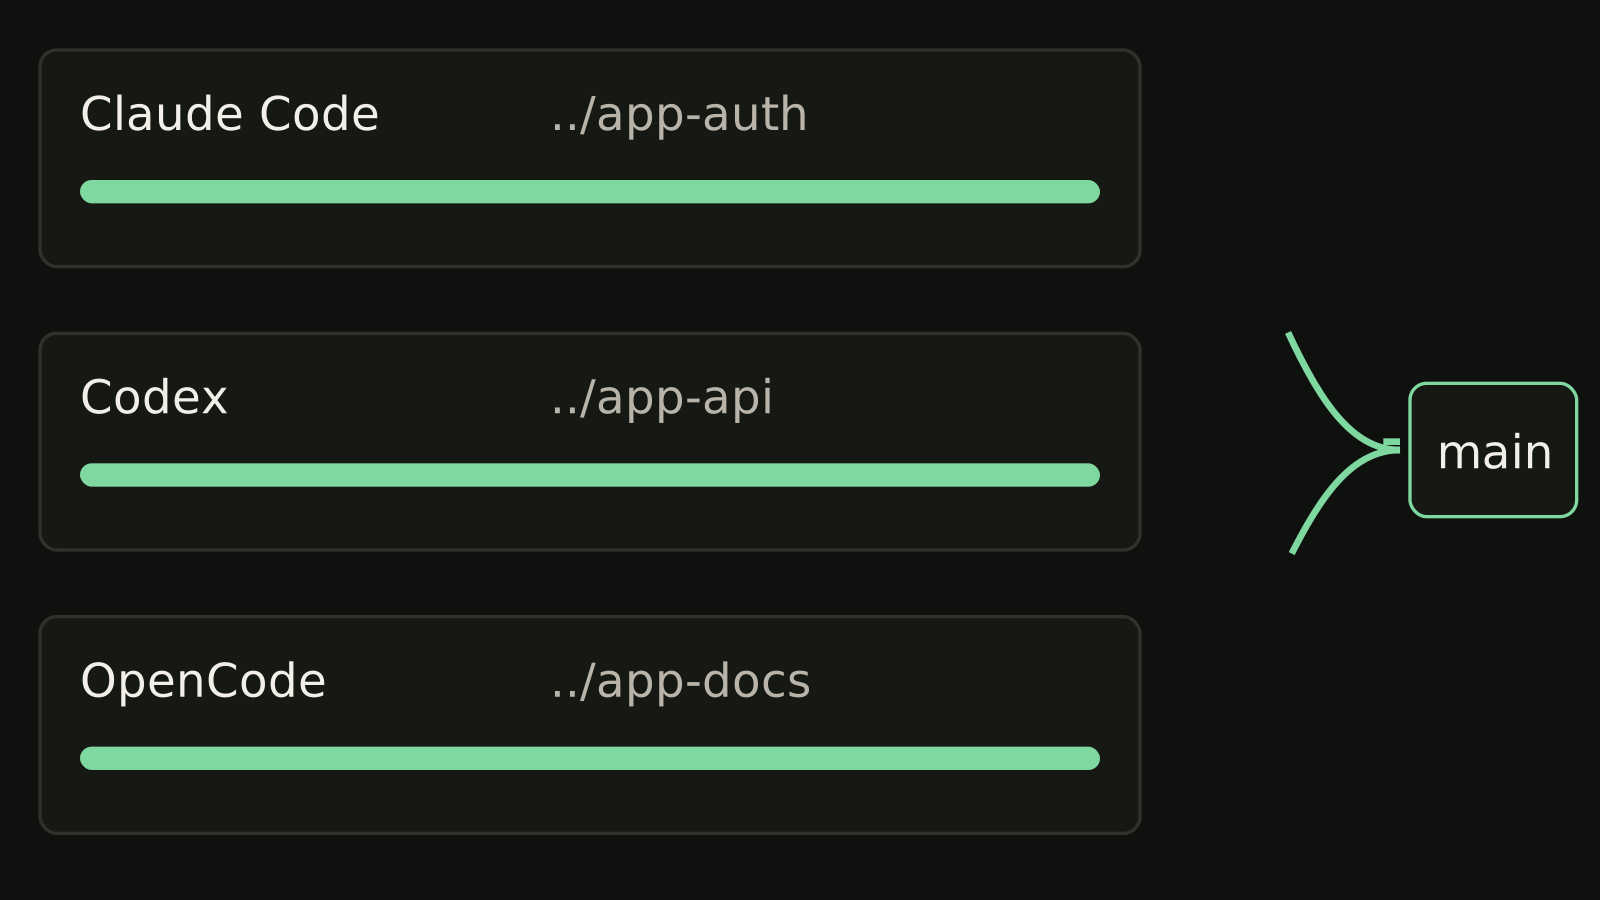
VibeiDE is a desktop app for macOS, Windows and Linux that coordinates the Codex, Claude Code and OpenCode CLIs you already installed. Each project has its own task queue, where waiting prompts can be edited or reordered and a task starts when its provider has a free slot. The usage display shows provider-reported usage, remaining runway and reset countdowns where the provider reports them, and finished tasks wait in Ready for review, which is an unread completion state, not a code approval. Each user signs in to their own provider accounts. A 14-day trial starts at first sign-in without a card. See VibeiDE for Claude Code or running agents in parallel.
FAQ
Does Claude Code have a dashboard?
Yes, several. /usage is the personal one, agent view (claude agents) shows live background sessions, and the analytics dashboard covers teams on Teams, Enterprise and Console plans.
Where is the Claude Code analytics dashboard?
At claude.ai/analytics/claude-code for Teams and Enterprise, and platform.claude.com/claude-code for Claude Console (API) organizations, as of November 2026.
Can individual Pro or Max users see the analytics dashboard?
The analytics documentation lists it for Teams, Enterprise and Console plans only. Pro and Max users get their numbers from /usage, Settings > Usage on claude.ai and /insights.
How do I see Claude Code cost per developer?
On the Console dashboard, the team insights table shows spend per member this month. On other setups, the OpenTelemetry metric claude_code.cost.usage with the user.id attribute gives per-user cost.
Takeaways
/usageis the personal Claude Code dashboard: limits, attribution and recommendations.claude agentsis the live dashboard for background sessions, each in its own worktree.- Teams and Console organizations get a hosted analytics dashboard with daily data.
- OpenTelemetry export (
CLAUDE_CODE_ENABLE_TELEMETRY=1) feeds any stack for real-time charts. - For several projects and agent CLIs, a per-project queue keeps track of what was asked where.